How to Read a CNC Machine Health Report: Degradation Stages, Observations, and Root-Cause Analysis Explained
What do the degradation stages, observations, urgency categories, and root-cause analysis in a Machine Health report mean?
Unplanned breakdowns and over-scheduled maintenance are two sides of the same expensive problem: you either fix the machine too late or too often, and either way the spindle is not cutting. A Machine Health report from IPercept changes that equation. It gives you a structured picture of where every axis, spindle, and drive actually stands, resolved all the way down to the individual component, so you can see the exact part that is wearing, how urgent it is, and what the most likely cause is. That component-level view is what turns monitoring into a clear maintenance decision.
This guide walks through every section of that report so you can read it confidently, brief your team, and make the right call the first time.
The IPercept Machine Health Service
IPercept's Machine Health service is the condition-monitoring service that produces the report described in this guide. It tracks the mechanical condition of every axis, spindle, and rotary drive on a machine, resolves that condition down to the individual components inside each one, and turns it into the degradation stages, observations, and root-cause picture you have just read. Reporting condition at the level of a single component, not just the machine or the axis, is what lets a report point straight to the part that needs attention.
It runs on a standalone smart device mounted on the machine's moving parts. The device runs a short, repeatable test cycle and derives the subsystem health picture from motion measurements alone. There is no connection to the machine controller and no integration with your IT network. The service works across virtually any CNC brand and age, which means the same report format and the same urgency logic applies whether your shop floor has machines from one builder or ten, new or decades old.
Test results are processed and published to the IPercept Portal typically within the hour. Email notifications alert you when a degradation is identified, so you are not waiting for a scheduled review to find out that something has changed.
All of this, down to every component.
Machine Health Is Reported Per Subsystem
A single traffic-light for the entire machine tells you almost nothing actionable. The spindle could be perfectly healthy while a ballscrew is weeks from failure, or vice versa. IPercept reports work at the subsystem level, producing a separate degradation stage for each monitored axis, rotary drive, and spindle on the machine.
That granularity matters because the decision you make for a spindle showing early wear is completely different from the decision you make for a linear axis that has crossed into the critical range. Mixing them into one number would average away the information you need most.
The Four Degradation Stages
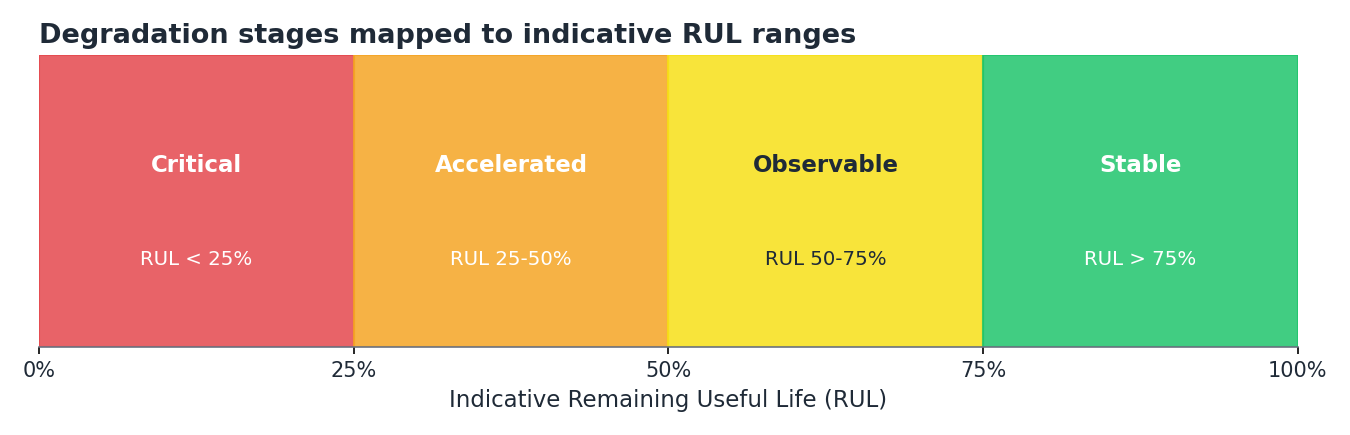
Each monitored subsystem sits in one of four stages, expressed as an indicative Remaining Useful Life (RUL) range. Think of RUL as the proportion of the subsystem's useful working life that is still ahead of it, not a countdown in calendar days.
- Stable (RUL above 75%, shown in green): The subsystem is performing within healthy bounds. It can absorb normal operating stress without an immediate concern. No maintenance action is required beyond keeping the test cycle running.
- Observable (RUL 50 to 75%, shown in yellow): Early signs of wear or degradation are present. The subsystem is still functioning, and IPercept monitors it more closely so you have early visibility and peace of mind.
- Accelerated (RUL 25 to 50%, shown in orange): Degradation is progressing at a higher rate. A scheduled intervention should be planned to get ahead of the condition before normal maintenance windows would typically anticipate it.
- Critical (RUL below 25%, shown in red): The subsystem is close to functional failure. Prompt action is required to protect uptime.
These four bands trace the well-established P-F curve logic: the window between detectable potential failure and functional failure is the cost-effective window for action. IPercept maps every subsystem to a position on that curve after every test cycle, so you always know where you stand.
Score Versus Stage
The report and the IPercept Portal both surface a degradation score alongside the degradation stage, and it helps to know what each one is answering.
The degradation score reflects the trend from a single test cycle. It captures the direction of travel after that particular run. A score that dips one week and recovers the next is normal measurement variability, and a single dip does not constitute a finding.
The degradation stage is the absolute position of the subsystem, computed across a statistically meaningful number of tests over time. It is the number that drives the report, the urgency category, and the maintenance recommendation. IPercept verifies the trend before updating the stage and before issuing any report, which is what keeps you from chasing false alarms.
When Does IPercept Issue a Report?
Reports are not issued on a purely calendar basis. A Machine Health report is generated at service start, whenever a monitored subsystem crosses a confirmed stage boundary, annually as a scheduled review, on request, and following a reported machine event such as a collision, a component replacement, or a planned overhaul. That event-driven cadence means you receive a report when the condition of the machine has actually changed, not just because the calendar says so.
Observations and Urgency Categories
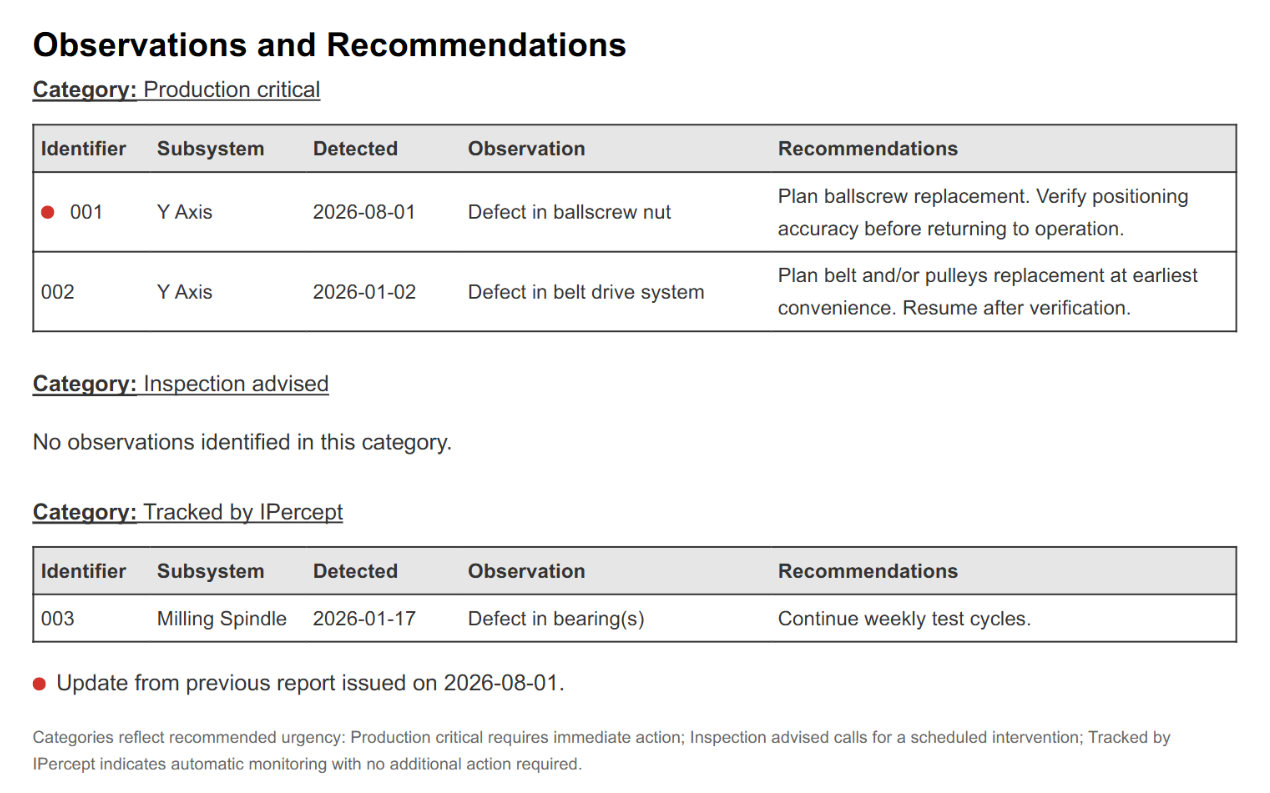
Below the summary overview, the report lists every active observation. Each one is grouped into one of three urgency categories, which translate directly into the action your team should take.
- Production Critical: IPercept flags this condition for prompt customer review. The subsystem's condition is such that waiting until the next scheduled maintenance window carries meaningful risk of an unplanned stoppage.
- Inspection Advised: A scheduled intervention is recommended. The condition is real but not yet urgent enough to disrupt current production. Use this category to build the work order now and source parts without rushing.
- No Action Required: IPercept is actively monitoring this observation. No action is required from your side at this stage. The condition is on the radar, the test cycles are doing the work, and you will be informed if the picture changes.
Every observation also carries a unique persistent identifier, a short numeric code that stays with that observation across every subsequent report until it is resolved. That identifier is the link between the observation in the summary section and its entry in the Root Cause Analysis. It also gives you a reference number when you contact IPercept support, so both teams are talking about exactly the same finding. Because it persists across reports, including the follow-up report issued after a repair or machine event, you can also confirm whether an intervention actually cleared the fault.
Component-Level Root Cause Analysis
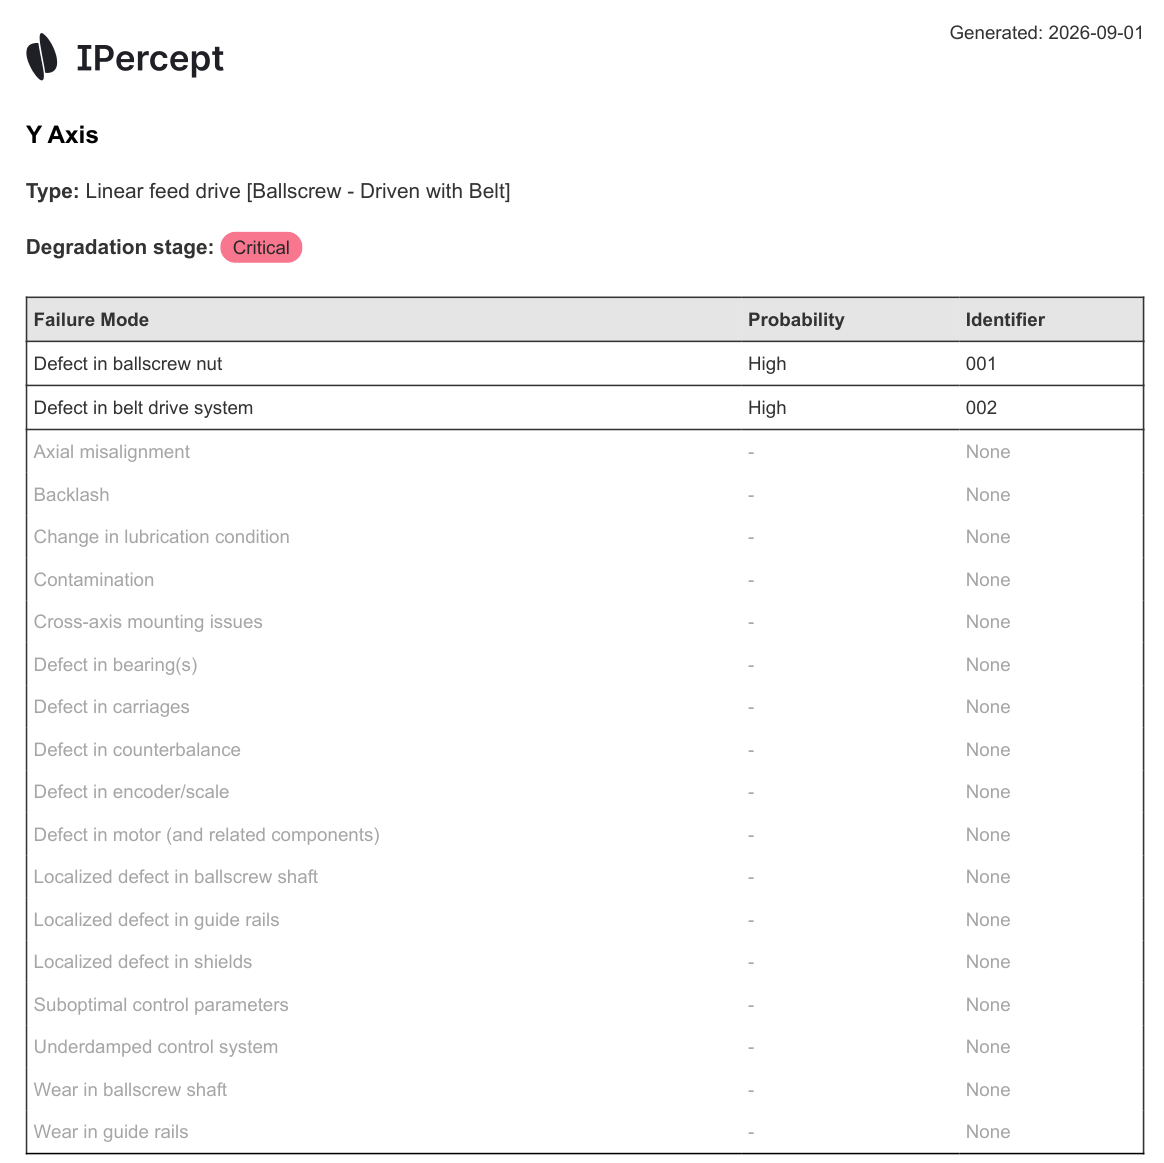
The Root Cause Analysis (RCA) is a subsystem-by-subsystem table that lists every failure mode the diagnostic model evaluates, along with the model's certainty that it is an active root cause and, where applicable, the observation identifier that links it to a finding.
A few things help when reading this table for the first time.
First, the table lists every failure mode the model can detect, whether or not there is any current sign of it. That is a statement of mechanical reality, not a warning. Any component can fail eventually. The table is designed to show you which failure modes the current test data makes statistically significant and which ones are showing no signal at this time.
Second, failure modes that show no linked identifier are not statistically significant at the time of the report. They appear in the table for completeness, so you can see that the model evaluated them and found nothing of note. A blank row is good news.
Third, when a failure mode does carry a certainty rating and an observation identifier, that pairing is the highest-value item in the report. It tells you not just that something is changing, but what the most probable mechanical root cause is. That specificity is what turns a report into a parts list and a work order.
An Example Case
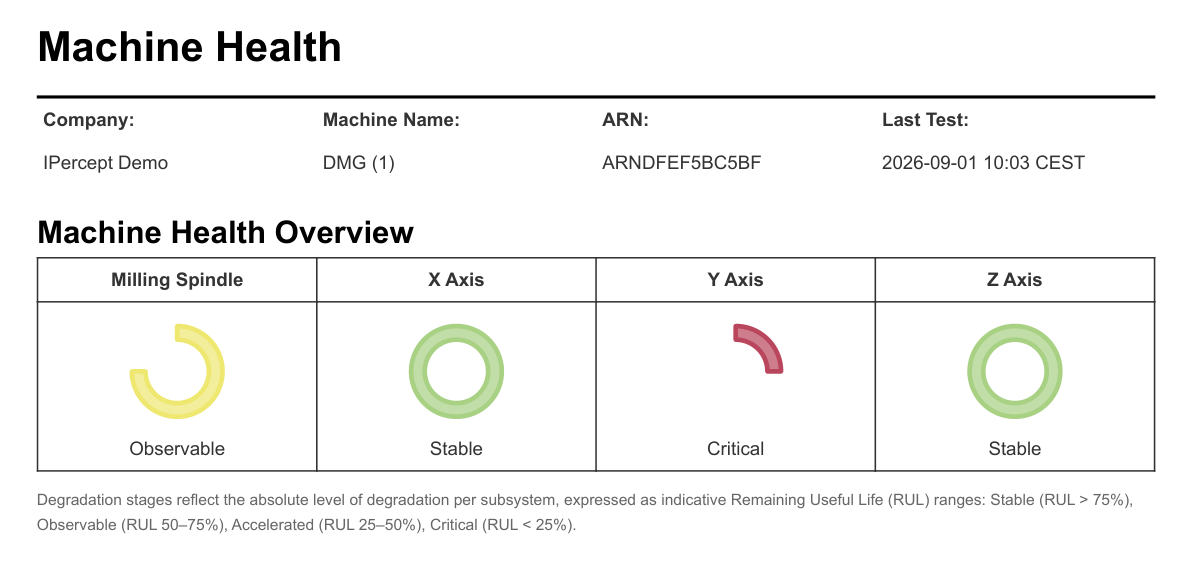
Consider a mid-size milling machine monitored by IPercept over several months. The machine overview shows the milling spindle in the Observable stage and the Y-axis in the Critical stage, while the X and Z axes are both Stable. At first glance that looks like a spindle problem, but the report tells a more precise story.
In the Observations section, two Production Critical items appear, both linked to the Y-axis: one identifying a defect in the ballscrew nut and a second identifying a defect in the belt drive system. Both observations carry unique identifiers and specific recommendations to plan ballscrew replacement and verify positioning accuracy before returning to full operation. The milling spindle carries a single observation in the No Action Required category, flagging a bearing defect as a medium-certainty cause, with no action required at this stage beyond continuing the weekly test cycles.
In the RCA for the Y-axis, the ballscrew nut and belt drive system are both flagged as high-certainty causes, with their identifiers linked. Every other failure mode in that subsystem shows no active identifier, confirming the model assessed them and found no signal. For the milling spindle RCA, the bearing defect is flagged at medium certainty with its identifier, while all other failure modes show no active observation.
The maintenance team can now walk into the next planning meeting with a clear brief: the Y-axis ballscrew is the priority, parts should be ordered and a replacement window scheduled, and the spindle bearing should be watched but not acted on yet. That is the kind of structured, evidence-based conversation that replaces gut-feel maintenance scheduling.
From Report to Maintenance Decisions
A Machine Health report read systematically, rather than skimmed for the red items, gives you three things a time-based maintenance schedule cannot: the current absolute condition of each subsystem, the most probable root cause of any active finding, and a ranked action list with urgency already assigned.
That combination lets you direct your maintenance budget toward the machines and subsystems that actually need attention, plan interventions during scheduled downtime instead of scrambling after a breakdown, and build the business case for the next capital decision with measured evidence rather than anecdote.
IPercept handles the analysis and the reporting. Your job is to read the result, assign the work order, and move on.
Book a demo with IPercept to see a Machine Health report for your machines and find out what your subsystems are telling you right now.
This paper draws on IPercept technical documentation and customer-reported results.
References
- Degradation stages expressed as indicative RUL ranges: Stable above 75%, Observable 50-75%, Accelerated 25-50%, Critical below 25% — IPercept - Machine Health & Portal Q&A (Q&A: Portal, Q2)
- The degradation score reflects the trend from a specific test, while the degradation stage expresses the absolute level of degradation — Machine Health (MH) Service Description (3.2 Machine Metrics)
- A report is issued at service start, upon confirmed worsening of degradation stage, yearly, on request, and following a machine event; IPercept verifies the trend before issuing a report and a single outlier does not trigger one — Machine Health (MH) Service Description (3.3 Machine Health Report)
- Observations are grouped into three urgency categories: Production Critical, Inspection Advised, and Tracked by IPercept (No Action Required) — Machine Health (MH) Service Description (3.3 Machine Health Report, Observations and Recommendations)
- Each observation carries a unique persistent identifier that survives across reports until the observation is resolved — Machine Health (MH) Service Description (3.3 Machine Health Report, Root Cause Analysis)
- Failure modes with no linked identifier are not statistically significant at the time of the report; all mechanical failure modes carry an inherent non-zero probability at any time — Machine Health (MH) Report (example) (Root Cause Analysis footer note)
- The example report shows Y Axis at Critical stage with Production Critical observations for defect in ballscrew nut and defect in belt drive system, and Milling Spindle at Observable with a Tracked by IPercept bearing observation — Machine Health (MH) Report (example) (Machine Health Overview and Observations)
- The service is based on motion and vibration measurements collected during test cycles; it does not connect to the machine controller and operates without IT network integration — Machine Health (MH) Service Description (1. Service Overview and 2. How It Works)
- Test results are processed and published to the Portal typically within the hour; email or SMS notifications are available — Machine Health (MH) Service Description (3.4 Automated Notifications and 2. How It Works Step 3)
- The PF curve tracks the journey from potential failure to functional failure; acting during the P-F interval is most cost-effective — Fundamental of Analytics - material (Predictive Model: Integrating PF Curve and Bearing Degradation Stages)


