How to Read a CNC Machine Health Report: Degradation Stages, Observations, and Root Cause Probabilities Explained
What do the degradation stages, observations, urgency categories, and root-cause probabilities in a Machine Health report mean?
The IPercept Machine Health Report shows degradation stages, numbered observations, urgency categories, and a table of failure-mode probabilities. This piece explains what each of those elements means mechanically, how they relate to each other, and what action each one calls for, using a concrete example report drawn from real report structure throughout.
A Machine Health report is a structured argument about mechanical condition, not a pass/fail alarm
The report makes a calibrated claim about where each monitored subsystem sits on its degradation curve, identifies the most probable root causes of any deviation, and assigns an urgency to each observation.[4] Reading it correctly means understanding three separate layers: the degradation stage per subsystem, the observations and urgency categories linked to each active finding, and the Root Cause Analysis (RCA) table that assigns failure-mode probabilities beneath each observation.[5]
These layers are related but distinct. A subsystem can be in a poor degradation stage without an active Production Critical observation, or it can carry a Tracked observation while still registering as Stable overall.
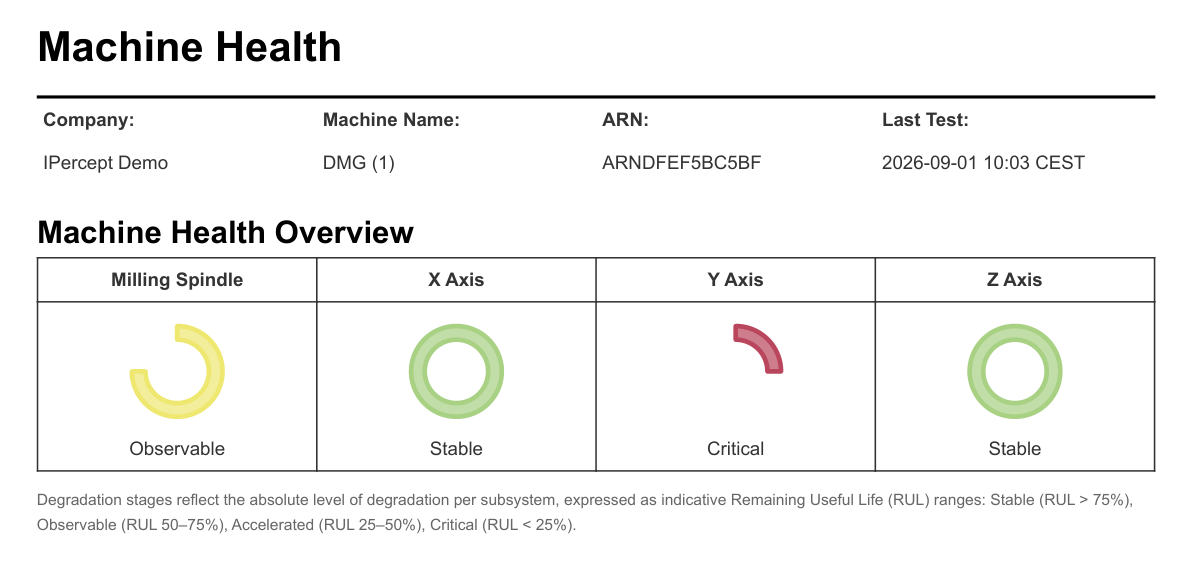
The running example throughout this piece is the DMG (1) report shown in the source material. That machine has four monitored subsystems: Milling Spindle (Observable), X Axis (Stable), Y Axis (Critical), and Z Axis (Stable).[4] Every principle stated below is applied immediately to that machine.
The degradation stage describes absolute mechanical condition
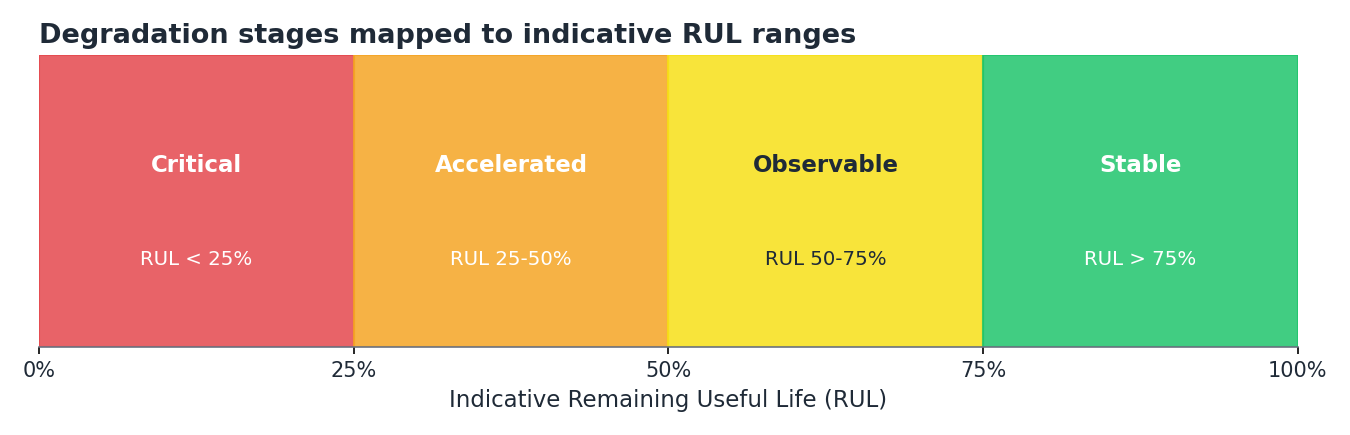
Each monitored subsystem carries a single degradation stage: Stable, Observable, Accelerated, or Critical.[3] These stages express the absolute level of degradation as an indicative Remaining Useful Life (RUL) range, derived from a statistically meaningful number of tests over time.[5]
StageIndicative RULColor codingStableRUL > 75%GreenObservableRUL 50–75%YellowAcceleratedRUL 25–50%OrangeCriticalRUL < 25%Red
On the DMG (1) report, the Y Axis is Critical (RUL below 25%) and the Milling Spindle is Observable (RUL 50–75%). The X and Z axes are both Stable.[4] Those four stage assignments give you a machine-wide picture in a single glance. The degradation score carries different information, covered next.
The degradation score and the degradation stage measure two different things
A degradation score is associated with a specific test and reflects how that individual test result sits relative to the subsystem's baseline.[3] The score can fluctuate test to test because minor changes in cleanliness, lubrication, or temperature all register in a high-sensitivity motion measurement.[3] The degradation stage, by contrast, is derived from a statistically meaningful number of tests over time and describes the absolute position on the subsystem life-cycle curve.[5]
The stage holds through a single poor score. The system verifies a trend before confirming a stage change, and a report is issued only after a worsening is confirmed across tests.[5] This distinction protects you from chasing noise. When you see the Y Axis at Critical in the DMG (1) report, that classification reflects a persistent, trend-verified condition across multiple test cycles.
Each stage maps to a defined position on the P-F interval
The staging model integrates two established reliability concepts: the Potential-to-Functional Failure (PF) curve and bearing degradation stages.[1] The PF curve identifies the window between when a failure first becomes detectable (the potential failure point, P) and when the component can no longer perform its function (the functional failure point, F). The P-F interval is the actionable window, and the four stages map subsystem condition across it.[1]
A Stable subsystem sits well before the potential failure point and can absorb minor shocks or lubrication variation without crossing into Observable.[1] An Observable subsystem has crossed the detection threshold: early-stage wear patterns are measurable while performance is still intact. An Accelerated subsystem is progressing rapidly through the P-F interval, and additional stress shortens the remaining window substantially.[1] A Critical subsystem is close to functional failure, and any additional load raises the probability of breakdown.[1]
On the DMG (1) machine, the Y Axis at Critical means that axis has consumed most of its P-F interval. The Milling Spindle at Observable means a deviation is measurable but stays below the point that mandates immediate intervention.
Reports are issued only on confirmed trend changes
Understanding when a report is generated tells you how much confidence to place in its conclusions. A Machine Health report is issued in five circumstances: at service start following initial calibration; when a monitored subsystem crosses a stage boundary on a verified trend; annually regardless of condition; on request; and following a reported machine event such as a collision, component replacement, or other intervention.[5]
Before any stage can be assigned, the system runs a set of test cycles spread over at least one week so it can learn the specific mechanical fingerprint of that installation, filtering out the ambient noise sources unique to that machine's surroundings.[5] Without calibration, normal environmental variability could be misread as mechanical deviation.[1] On the DMG (1) example, calibration was completed on 2025-03-17 for all four subsystems.[4]
When a report arrives between annual cycles, it means the system detected and confirmed a trend change. The Y Axis reaching Critical on the DMG (1) report triggered that report because a stage boundary was crossed on a verified trend.[5]
Observations and urgency categories translate condition into action and timing
The Observations and Recommendations section is the operational core of the report. It lists each identified fault condition grouped into one of three urgency categories: Production Critical, Inspection Advised, and Tracked by IPercept.[5]
CategoryWhat it meansProduction CriticalRequires immediate attentionInspection AdvisedA scheduled intervention is recommendedTracked by IPerceptActively monitored; no action required from you at this stage
On the DMG (1) report, observation 001 (Defect in ballscrew nut, Y Axis, first detected 2026-08-01) and observation 002 (Defect in belt drive system, Y Axis, first detected 2026-01-02) are both Production Critical, with recommendations to plan ballscrew replacement and belt/pulley replacement respectively, and to verify positioning accuracy before returning the axis to operation.[4] Observation 003 (Defect in bearings, Milling Spindle, first detected 2026-01-17) sits in Tracked by IPercept with a recommendation to continue weekly test cycles.[4] Nothing appears in the Inspection Advised category for this machine at this reporting date.
An empty category is itself a result, showing the analysis found nothing in that band. The absence of any Inspection Advised items on the DMG (1) report means the analysis found no conditions that sit between immediate action and passive monitoring at that point in time.
The observation identifier is a persistent tracking reference across successive reports
Every observation carries a unique identifier (001, 002, 003 in the example) that persists across successive reports until the observation is resolved.[5] This persistence is deliberate. It allows you to track how a specific condition evolves through the report history and to reference the exact finding when contacting technical support, without having to describe the symptom from scratch.[5]
The detection date recorded against each observation is the date the condition was first identified, usually earlier than the current report date. Observation 002 on the Y Axis was first detected on 2026-01-02, months before the report date of 2026-09-01.[4] That date gap tells you how long the condition has been tracked and at what point it crossed from monitored to critical. Reading detection dates relative to the current report date is one of the fastest ways to assess how rapidly a condition has progressed.
The gap between a detection date and the report date indicates progression velocity
The DMG (1) report is dated 2026-09-01 and notes it is an update from a previous report issued on 2026-08-01.[4] That note confirms this is a trend-verified update following the initial calibration report. The Milling Spindle bearing observation (003), first detected 2026-01-17 and still in Tracked status on 2026-09-01, has been monitored for over seven months without escalating to Inspection Advised or Production Critical. The condition exists but is progressing slowly.
The Root Cause Analysis table
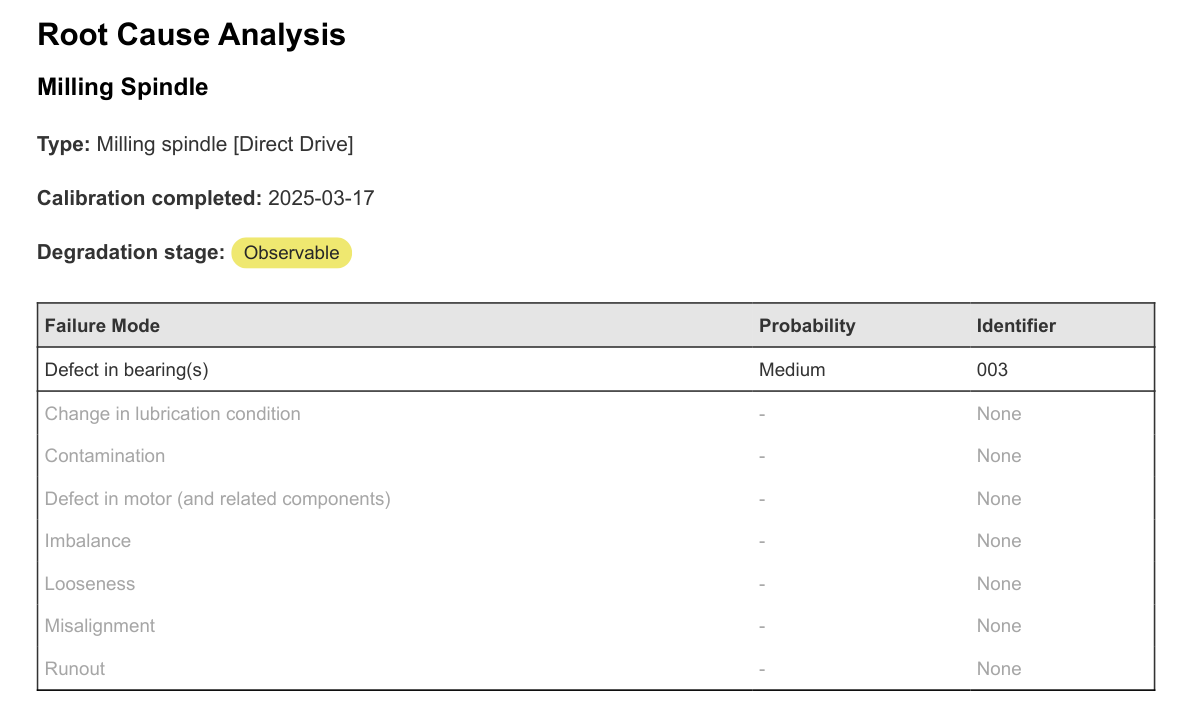
The RCA section is where most readers misinterpret the report. Each subsystem's RCA lists every failure mode the system evaluates for that subsystem type, shows an assessed probability for each, and links any active finding to its observation identifier.[5]
For the Y Axis on the DMG (1) machine, the failure modes Defect in ballscrew nut and Defect in belt drive system both show High probability and carry identifiers 001 and 002 respectively. Every other failure mode on the Y Axis list shows a dash and the entry None under identifier.[4] The report carries the following note: "All mechanical failure modes carry an inherent non-zero probability at any point in time. Failure modes with no linked identifier have no active observation and are not statistically significant at the time of this report."[4]
A dash means the current signal contains no statistically significant evidence of that mode. A ballscrew shaft defect on the Y Axis shows None at this reporting date, which tells you the motion signature for that mode currently sits below the significance threshold. Condition can change, and subsequent tests will continue to evaluate all modes.[5]
Probability levels indicate relative signal strength, and urgency categories indicate required response speed
The probability descriptors (High and Medium in the example) reflect how strongly the current motion data supports a particular failure mode as the root cause of the observed deviation.[1] The urgency of required action is carried by the observation's category. The RCA table answers what is most likely causing this deviation, while the observation category answers how fast you must act.
On the Milling Spindle for the DMG (1) machine, Defect in bearings shows Medium probability and is linked to identifier 003 (Tracked by IPercept).[4] All other spindle failure modes show None. The bearing deviation is measurable and assigned a root cause with medium confidence, but the condition remains at Observable because the trend has yet to verify a stage change. The spindle remains at Observable.
The failure mode list reflects each subsystem's type and drive configuration
The set of failure modes evaluated in the RCA is specific to the subsystem type and drive configuration of the monitored component.[2] The Y Axis on the DMG (1) machine is a linear feed drive with a ballscrew driven by a belt.[4] Its RCA therefore includes Defect in ballscrew nut, Defect in belt drive system, Defects in carriages, Defect in bearing(s), Axial misalignment, and more than a dozen additional modes relevant to that configuration.[4] A turning spindle RCA would include Imbalance, Misalignment, Defect in bearing(s), Change in lubrication condition, and Defect in motor among others, because those are the modes physically relevant to that subsystem type.[2]
Comparing RCA tables across different subsystem types on the same machine will show different failure mode lists. The table boundary is drawn by the physics of what that subsystem can fail from, given its configuration.[2]
Stage, observation, and RCA form a complete diagnostic chain that must be read together
Taken together, the three layers of the report form a linked argument. The degradation stage tells you how much of the P-F interval has been consumed. The observation and urgency category translate that position into an action and a timeline. The RCA table identifies which specific failure mechanism is most likely responsible.[5]
On the DMG (1) machine, the Y Axis is at Critical (less than 25% RUL remaining), carrying two Production Critical observations for ballscrew nut defect and belt drive system defect, both with High probability in the RCA. The recommended actions are to plan ballscrew replacement and belt/pulley replacement and to verify positioning accuracy before returning the axis to operation.[4] That chain from stage to observation to RCA to recommendation is complete and internally consistent.
The Milling Spindle chain is less urgent but still active: Observable stage, Tracked observation for bearing defect, Medium probability in the RCA, recommendation to continue weekly cycles.[4] The correct response is continued monitoring at the current test frequency. Attempting to pre-empt a Tracked condition with unscheduled maintenance could introduce new failure modes (misalignment, incorrect preload) without addressing a problem that has yet to escalate.[1]
Test frequency and timing set the resolution of the trend data behind the report
The report is only as current as the most recent test cycle, and test frequency determines how quickly a developing condition is reflected in the staging data. The recommended minimum is at least one test per week, with higher frequency appropriate during periods of elevated system volatility or in later degradation stages.[5] The DMG (1) report's last test was 2026-09-01 at 10:03 CEST.[4] If the Y Axis is in Critical condition and three weeks pass before the next test, the report shows no further change during that gap.
A machine event, such as a collision, lubrication service, or component replacement, can change the mechanical condition independently of the scheduled test cycle. The correct procedure is to notify the service provider of the event, trigger an on-demand test, and wait for an updated assessment before drawing conclusions from the pre-event report.[5] If the post-event analysis confirms a condition change, an updated report is issued. If no measurable change is detected, the existing report remains valid and you are informed accordingly.[5]
Because data is collected during discrete test cycles, sudden events unrelated to cumulative degradation (for example a collision or an abrupt lubrication failure) first appear at the next scheduled test.[3] The report reflects the condition at the time of the last completed test cycle, and interpretation should account for any events that occurred after that test.
Working through a Machine Health report in practice requires following a fixed sequence
- Confirm the report date and last test date. Check whether any machine events have occurred since the last test. If so, the report may predate the current post-event condition. Request an on-demand test before acting on the report's recommendations.
- Read the Machine Health Overview first. Note the degradation stage of each subsystem. Identify any subsystem at Critical or Accelerated; those demand the most immediate attention regardless of observation content.
- Check the Observations section by urgency category. Address Production Critical observations first. For each, note the detection date, the affected subsystem, and the recommended action. Compare detection dates across observations to assess how long each condition has been active and whether it escalated quickly or slowly.
- Locate each observation's identifier in the RCA table. Confirm that the failure mode probability for that identifier is consistent with the urgency category. High probability paired with Production Critical is the highest-confidence finding. Medium or Low probability with Tracked status calls for continued monitoring.
- Review all failure modes listed as None in the RCA. Treat them as statistically insignificant at this reporting date. All mechanical failure modes carry an inherent non-zero probability at any time, and subsequent tests continue to evaluate them.
- Compare the current degradation stage to any previous report for the same subsystem. A stage that has moved from Observable to Critical between two reports with a short elapsed time indicates rapid progression and warrants prioritizing parts procurement and scheduling promptly.
- Plan maintenance actions against the full diagnostic chain. Match each planned action to the specific observation identifier and the RCA's top failure mode. Document the completed action, notify the service provider, and request an updated assessment to confirm whether the condition has resolved.
- Set or review the test cycle frequency. Subsystems at Accelerated or Critical benefit from more frequent tests during the period leading up to and following any maintenance intervention, to confirm the condition is not progressing further before the planned work occurs.
IPercept's Machine Health service produces the report structure described in this article
IPercept provides condition-monitoring services for CNC machine tools across milling, turning, grinding, and other numerically controlled machine types.[5] The Machine Health service is the source of the report structure described throughout this piece.
A sensor device is mounted on the moving parts of the machine's kinematic chain. During a short, repeating test cycle (typically around five minutes), the device records motion and vibration data as the machine runs the predefined motion sequence.[3] Those measurements are processed through physics-based digital twin models that compare actual motion against expected motion for that specific subsystem configuration, assigning failure-mode probabilities and computing degradation scores and stages per subsystem.[5] The method is motion-based and patented.[3]
The service operates as a standalone device, independent of the machine controller and the customer's IT network. It works across many brands and ages of CNC machine, which makes it applicable to mixed-age fleets where controller data is incomplete or unavailable.[5] Results are published to the IPercept Portal typically within the hour of a completed test, and automated notifications alert users when a degradation is identified.[5]
Because monitoring is based on periodic test cycles, sudden events between tests surface only when the next cycle runs.[3] The service's value is in detecting and tracking cumulative mechanical degradation, prioritizing maintenance actions, and providing a traceable record of condition change over time.
If you want to see how the report maps to a specific machine type in your fleet, the practical starting point is to run the calibration sequence and review the first report generated at service start. Contact IPercept to discuss how the service applies to your specific machines and maintenance workflow.
References
- Stages of subsystem health map subsystem condition across the P-F interval; degradation stages and the PF curve integration; acting during the P-F interval is most cost-effective; a Stable subsystem can absorb minor shocks; Accelerated means rapid progression; Critical means close to functional failure — Fundamental of Analytics - material (Predictive Model: Integrating PF Curve and Bearing Degradation Stages; Stages of Subsystem Health; Changing the Odds)
- Failure mode lists are specific to subsystem type and configuration; linear feed drive and spindle failure modes listed by type — IPercept - Fault Types & Modes - Jan 2026 (Table 1 - CNC Machine - fault types and failure modes)
- Test cycle is a patented set of tests approximately five minutes long; degradation score vs trend distinction; calibration process; the service does not monitor continuously so sudden events can still occur; scores fluctuate due to cleanliness, lubrication, temperature — IPercept - Machine Health & Portal Q&A (Q&A: Machine Health Q3, Q6; Q&A: Portal Q2, Q5, Q8, Q11)
- DMG (1) report example: four subsystems with their stages; observation identifiers 001, 002, 003 with detection dates, urgency categories, and recommendations; RCA tables for each subsystem; the note on non-zero probability and statistical significance — Machine Health (MH) Report (example) (Machine Health Overview; Observations and Recommendations; Root Cause Analysis tables)
- Report is issued at service start, on confirmed stage worsening verified by trend, annually, on request, and after machine event; observation identifier persists across reports until resolved; degradation stage is absolute RUL range; degradation score reflects individual test trend; RCA links failure modes to observations; service monitors linear axes, rotary axes, spindles; standalone, no controller or IT connection; works across many machine types and ages; publishes results within the hour; calibration runs over at least one week — Machine Health (MH) Service Description (Sections 2, 3.2, 3.3, 4, 5.3)


